|
<< Click to Display Table of Contents >> Build-ups |
  
|
|
<< Click to Display Table of Contents >> Build-ups |
  
|
This page contains five graphs of which four are displayed. Each graph contains 100 random curves. All graphs have time on the horizontal axis. On the vertical axes are:
•percentage of shattered concrete,
•percentage of surface faulting,
•International Roughness Index, and
•total E80 imposed on the pavement so far.
However, in case of continuously reinforced concrete, a graph for crack spacing is displayed instead of that for the percentage of faulting. The purpose of a build-up graph is to show how a variable, such as the percentage of shattered concrete, is likely to develop over a period of time.
The user should evaluate Build-ups once the calculation process has been executed and the calculation reminder flag is invisible (e.g. no need for calculations as data has not changed). Please note that Build-ups takes time to load as charts include a lot of information.
Under Build-ups, a number of graphs will be provided. It is possible to export a graph to either Adobe Pdf format or WMF. WMF is a vector format which means that it will not loose its quality when re-sized in Microsoft Word or other compatible applications.
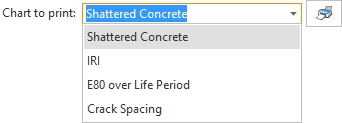
To export a chart, select the chart from the drop-down list as illustrated below:

Click the Print button next to the drop-down. A menu will appear from where the export
format should be selected. This is illustrated below:

Once selected, cncPAVE will export the chart as requested. Please note that this action will differ per Internet Browser.