|
<< Click to Display Table of Contents >> Distributions |
  
|
|
<< Click to Display Table of Contents >> Distributions |
  
|
This page contains five graphs, namely:
1.Shattered Concrete Distribution
4.Crack Spacing Distribution and
The user should evaluate Distributions once the calculation process has been executed and the calculation reminder flag is invisible (e.g. no need for calculations as data has not changed).
Under Distributions, a number of graphs will be provided. It is possible to export a graph to either Adobe Pdf format or WMF. WMF is a vector format which means that it will not loose its quality when re-sized in Microsoft Word or other compatible applications.
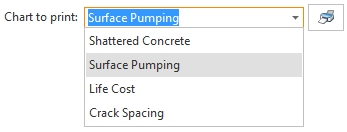
To export a chart, select the chart from the drop-down list as illustrated below:

Click the Print button next to the drop-down. A menu will appear from where the export
format should be selected. This is illustrated below:

Once selected, cncPAVE will export the chart as requested. Please note that this action will differ per Internet Browser.
Of the five graphs four are visible at any time. Three graphs, viz. 1, 2 and 5 are always visible. The fourth graph depends on the pavement type selection. If Continuously Reinforced concrete (CR), or Ultra-Thin Continuously Reinforced concrete (UT) is selected the fourth graph is number 4. Otherwise it is graph number 3.
Each graph displays the probability distribution of a decision variable as determined during the recent simulation run. At the same time, the de-cumulative ('greater-than') distribution is constructed and displayed - see the thick descending curve in each graph. The ordinates (y-values) of this curve indicate the probability of the decision variable exceeding the value selected on the x-axis.
Two horizontal lines are plotted in each graph. The upper line is at the 95 % probability and the lower one at 5 % probability. The 90 % confidence interval for a given decision variable stretches, as measured on the x-axis, between the intercepts of the two broken lines with the thick de-cumulative ('greater-than') curve.
Please remember that there is no distribution graph for the International Roughness Index (IRI), the information on this item is shown on the Facts and Build-up Pages.