|
<< Click to Display Table of Contents >> Facts |
  
|
|
<< Click to Display Table of Contents >> Facts |
  
|
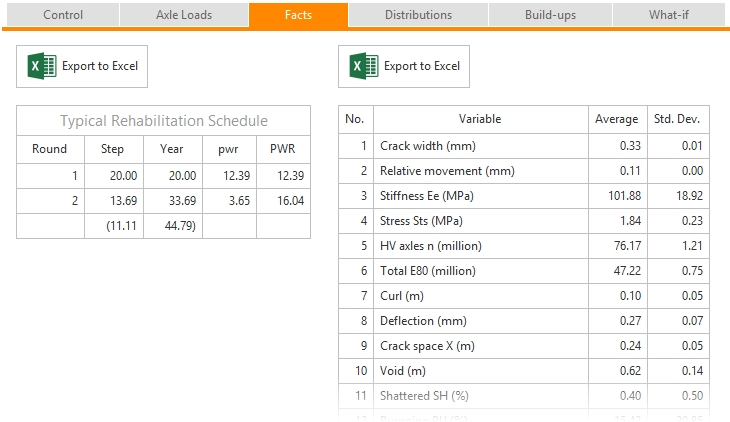
The user should evaluate Facts once the calculation process has been executed and the calculation reminder flag is invisible (e.g. no need for calculations as data has not changed). Under Facts, the user will find a Typical Rehabilitation Schedule as well as a Facts Table.
Please note that it is possible to export each table to Microsoft Excel. The Facts section is illustrated below:

The Typical rehabilitation schedule has five columns as follows:
Rnd round of rehabilitation action; 1st, 2nd, 3rd, 4th, etc.
Step period of time, in years, after which the particular rehabilitation action will be needed
Year the year, after the beginning, in which the action will be needed
pwr present worth, in COST/m2, of the particular rehabilitation action
PWR present worth, in COST/m2, of all rehabilitation actions performed so far
It is assumed that, should the effect of the last rehabilitation outlast the life period, the extent of the last action will be limited to cover only the interval from this action to the end of life period. The cost of this limited rehabilitation action is calculated on a pro-rata basis for the shortened period. In this case, the pwr and PWR figures pertain to this shortened period only, and the Step and Year of a would-be-next rehabilitation are shown in brackets.
Consider a simple example: The life period is 40 years. A rehabilitation whose present worth pwr is R20/m2 is required in year 34. The next rehabilitation would be needed in year 42.
Since the effect of a full rehabilitation performed in year 34 would outlast the end of the life period, only a limited rehabilitation action will be taken in that year. The present worth of that limited action is calculated on a pro-rata basis: R20/m2 x (40 - 34) / (42 - 34) = 20 x 6 / 8 = R 15/m2. The last rehabilitation thus contributes R15/m2 rather than R20/m2 to the present worth PWR of the upkeep during the life period of 40 years.
For more information on the rehabilitation cost please click the blue text.
The Table of output items has three columns, viz.
Variable Average Standard deviation,
and 17 rows, one for each of 17 output items, namely
1.Crack width, mm
2.Relative vertical movement, mm
3.Stiffness Ee, MPa
4.Stress Sts, MPa
5.HV axles n, million
6.Total E80, million
7.Curl, m
8.Deflection, mm
9.Crack spacing X, m
10.Void, m
11.Shattered SH, %
12.Pumping PU, %
13.Faulting FA, %
14.Construction cost, COST/m2
15.Present worth of rehabilitation cost, COST/m2
16.Life cost, COST/m2
17.International Roughness Index (IRI), m/km
The output items were obtained from random input variables by means of simulation. For this reason each output item is a random variable. The averages (means) and standard deviations of these output variables, as determined during the simulation, are shown in the appropriate columns of the table.
Six of the output variables are the so-called decision variables, viz.
9. Crack spacing X, m
11. Shattered SH, %
12. Pumping PU, %
13. Faulting FA, %
16. Life cost, COST/m2
17. International Roughness Index (IRI), m/km
Apart from determining the mean and standard deviation, the whole probability distribution is plotted for each decision variable on the Distributions Page; however, not for IRI - this information is on the Build-ups Page.